14-Apr-2023
.
Admin
Hi friends,
Today, I am explaining how to use Google chart in laravel 10. you will learn dynamic charts in laravel 10. I will discuss laravel charts step by step so that you can understand. To engender dynamic pie charts in Laravel I will utilize Google chart in Laravel 10. In this tutorial, I will show you a 2d and 3d pie chart where you can show how to transmute Google chart options.
Google Charts provides an impeccable way to visualize data on your website. You can do dynamic pie charts in laravel utilizing Chart js with Laravel. But here I will utilize Google chart.
Step 1: Download Laravel
Let us begin the tutorial by installing a new laravel application. if you have already created the project, then skip the following step.
composer create-project laravel/laravel example-app
Step 2: Add Route
first of all, we will create a simple route for creating a simple line chart. so let's add simple routes like below:
routes/web.php
<?php

use Illuminate\Support\Facades\Route;
use App\Http\Controllers\GoogleChartController;

/*
|--------------------------------------------------------------------------
| Web Routes
|--------------------------------------------------------------------------
|
| Here is where you can register web routes for your application. These
| routes are loaded by the RouteServiceProvider within a group which
| contains the "web" middleware group. Now create something great!
|
*/

Route::get('chart', [GoogleChartController::class, 'index']);
Step 3: Add Controller
Here, we will create a new controller as GoogleChartController. so let's add the bellow code on that controller file.
php artisan make:controller GoogleChartController
app/Http/Controllers/GoogleChartController.php
<?php

namespace App\Http\Controllers;

use Illuminate\Http\Request;
use App\Models\User;
use DB;

class GoogleChartController extends Controller
{
    /**
     * Write code on Method
     *
     * @return response()
     */
    public function index()
    {
        $users = User::select(DB::raw("COUNT(*) as count"), DB::raw("MONTHNAME(created_at) as month_name"))
                    ->whereYear('created_at', date('Y'))
                    ->groupBy('month_name')
                    ->orderBy('id', 'ASC')
                    ->pluck('count', 'month_name');

        return view('chart', compact('users'));
    }
}
Step 4: Add Blade File:
resources/view/chart.blade,php
<!DOCTYPE html>
<html>
<head>
    <title>How to use Google Chart in Laravel 10? - Nicesnippets.com</title>
    <link href="https://cdn.jsdelivr.net/npm/bootstrap@5.0.0/dist/css/bootstrap.min.css" rel="stylesheet">
</head>

<body>
    <h1 class="text-center my-3">How to use Google Chart in Laravel 10? - Nicesnippets.com</h1>
    <div id="google-line-chart" style="height: 500px"></div>
</body>

<script type="text/javascript" src="https://www.gstatic.com/charts/loader.js"></script>
<script type="text/javascript">

    google.charts.load('current', {'packages':['corechart']});
    google.charts.setOnLoadCallback(drawChart);

    function drawChart() {

    var data = google.visualization.arrayToDataTable([
        ['Month Name', 'Register Users Count'],

            @php
                foreach($users as $key => $value) {
                    echo "['".$key."', ".$value."],";
                }
            @endphp
    ]);

    var options = {
      title: 'Register Users Month Wise',
      curveType: 'function',
      legend: { position: 'bottom' }
    };

      var chart = new google.visualization.LineChart(document.getElementById('google-line-chart'));

      chart.draw(data, options);
    }
</script>
</html>
Step 5: Add Dummy Records:
Here, we need to add some dummy records on the users table monthly wise.
you can create dummy records using laravel tinker command as below:
php artisan tinker
User::factory()->count(30)->create()
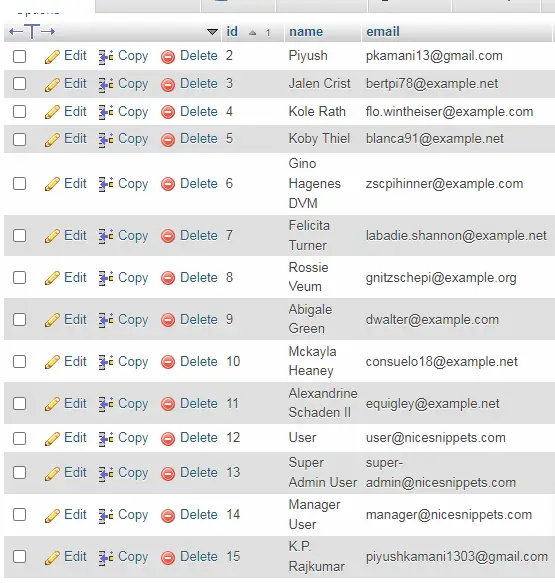
You need to create users each month with the created date as below screenshot:
Run Laravel App:
All steps have been done, now you have to type the given command and hit enter to run the Laravel app:
php artisan serve
Now, you have to open the web browser, type the given URL and view the app output:
http://localhost:8000/push-notification
I hope it can help you...
#Laravel 10
