10-Apr-2023
.
Admin

Hi Guys,
In this blog, I will learn you how to use Charts JS Chart in laravel 9. we will show example of laravel 9 charts js chart.Laravel 9 Blade template engine is awesome. you can easyly use PHP variable, js and js library in laravel 9 view. i will create chart using Chart.js in laravel 9 application. Chartjs is a js library, this library through we can use bar chart, line chart, area chart, column chart etc, C]chart.js also provide sevral theme.
whenever you need to add charts in laravel 9 server side. then you can easily use following example you have to fetch data from database and then set in Chart JS function, In this post i will give you simple example to create bar chart using chart js that way you can use in your laravel 9 application.
Here, I will give you full example for laravel 9 charts js chart as bellow.
Step 1: Download Laravel
Let us begin the tutorial by installing a new laravel application. if you have already created the project, then skip following step.
composer create-project laravel/laravel example-app
Step 2: Add Route
In this step, first add chartjs route in your routes.php file.
routes/web.php
<?php

use App\Http\Controllers\ChartJsController;

/*
|--------------------------------------------------------------------------
| Web Routes
|--------------------------------------------------------------------------
|
| Here is where you can register web routes for your application. These
| routes are loaded by the RouteServiceProvider within a group which
| contains the "web" middleware group. Now create something great!
|
*/

Route::get('chartjs', [ChartJsController::class, 'index'])->name('chartjs.index');
Step 3: Add Controller
we are going to create a controller for following commands:
php artisan make:controller ChartJsController
Now you can edit the file in app/Http/Controllers/ChartJsController.php.
app/Http/Controllers/ChartJsController.php
<?php

namespace App\Http\Controllers;

use Illuminate\Http\Request;
use App\Models\User;
use DB;
use Carbon\Carbon;

class ChartJsController extends Controller
{
    /**
     * Write code on Method
     *
     * @return response()
     */
    public function index()
    {
        $year = ['2015','2016','2017','2018','2019','2020'];

        $user = [];
        foreach ($year as $key => $value) {
            $user[] = User::where(\DB::raw("DATE_FORMAT(created_at, '%Y')"),$value)->count();
        }

        return view('chartjs')->with('year',json_encode($year,JSON_NUMERIC_CHECK))->with('user',json_encode($user,JSON_NUMERIC_CHECK));
    }
}
Step 4: Add Blade File
In this step,i will create chartjs view file.
resource/view/chartjs.blade.php
@extends('layouts.app')

@section('content')
<div class="container">
    <div class="row">
        <div class="col-md-10 offset-md-1">
            <div class="panel panel-default">
                <div class="panel-heading">Dashboard</div>
                <div class="panel-body">
                    <canvas id="canvas" height="280" width="600"></canvas>
                </div>
            </div>
        </div>
    </div>
</div>
<script src="https://cdnjs.cloudflare.com/ajax/libs/Chart.js/2.9.3/Chart.min.js"></script>
<script>
    var year = <?php echo $year; ?>;
    var user = <?php echo $user; ?>;
    var barChartData = {
        labels: year,
        datasets: [{
            label: 'User',
            backgroundColor: "pink",
            data: user
        }]
    };

    window.onload = function() {
        var ctx = document.getElementById("canvas").getContext("2d");
        window.myBar = new Chart(ctx, {
            type: 'bar',
            data: barChartData,
            options: {
                elements: {
                    rectangle: {
                        borderWidth: 2,
                        borderColor: '#c1c1c1',
                        borderSkipped: 'bottom'
                    }
                },
                responsive: true,
                title: {
                    display: true,
                    text: 'Yearly User Joined'
                }
            }
        });
    };
</script>
@endsection
Run Laravel App:
All steps have been done, now you have to type the given command and hit enter to run the laravel app:
php artisan serve
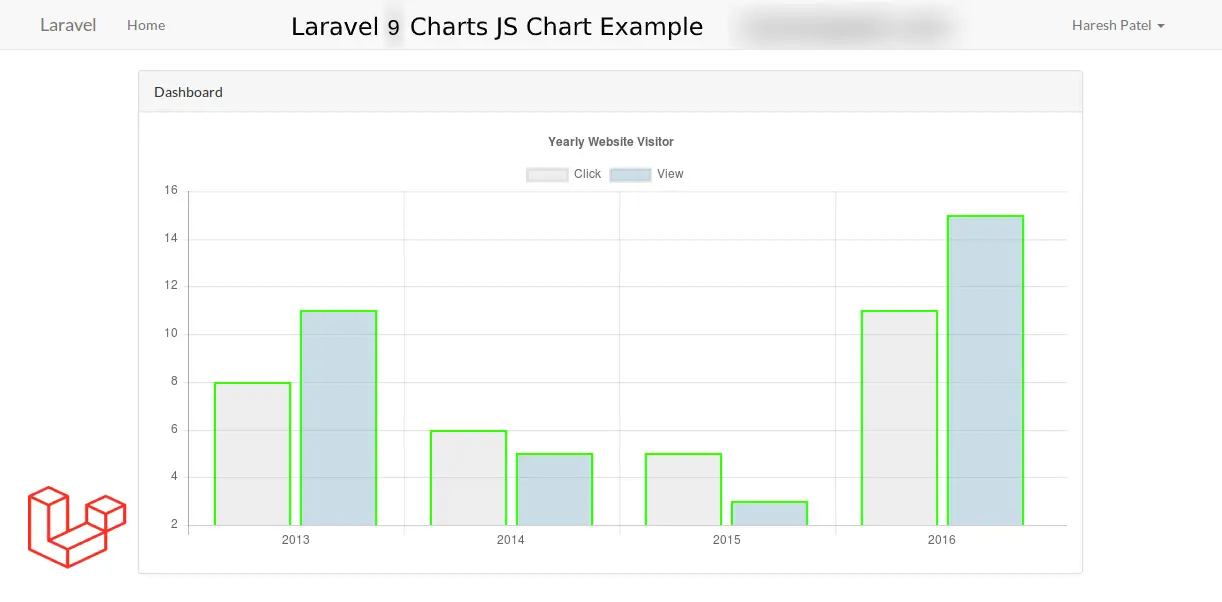
Now, you have to open web browser, type the given URL and view the app output:
http://localhost:8000/chartjs
It will help you....
#Laravel 9