11-Apr-2023
.
Admin
Hello Friends,
In this blog, I will learn you easing effect using jquery ui. How to perform easing effect using jquery ui.
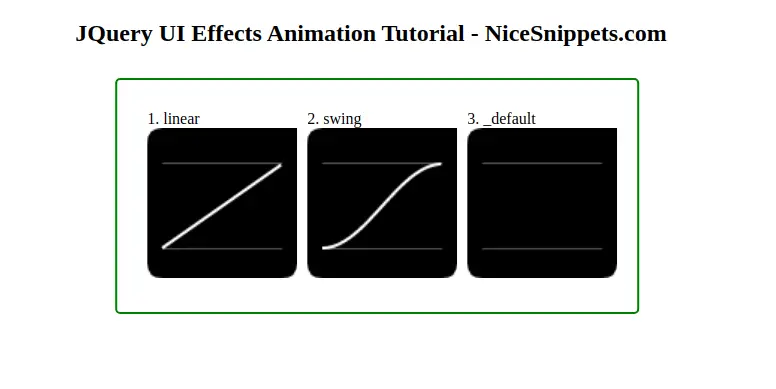
jQueryUI Easing function is used to specify the rate of change of a parameter with respect to time. There are different types of easing functions in jQuery like linear, swing etc. Some easing provides their result in negative value during the animation.
Example
<!doctype html>
<html lang="en">
<head>
    <meta charset="utf-8">
    <meta name="viewport" content="width=device-width, initial-scale=1">
    <title>jQuery UI Effects - Easing Example</title>
    <link rel="stylesheet" href="https://code.jquery.com/ui/1.12.1/themes/base/jquery-ui.css">
    <style>
        canvas{
            width:150px !important;
        }
        .graph{
            width:150px !important;
            float: left;
            margin-left: 10px;
        }
        .main-class{
            margin:-107px auto;
            transform: translate(80%,50%);
            border-radius: 5px;
            padding:30px 20px;
            border:2px solid green;
            position: absolute;
        }
    </style>
    <script src="https://code.jquery.com/jquery-1.12.4.js"></script>
    <script src="https://code.jquery.com/ui/1.12.1/jquery-ui.js"></script>
</head>
<body>
	<h2 style="text-align: center;">JQuery UI Effects Animation Tutorial - NiceSnippets.com</h2>
    <div class="main-class">
        <div id="graphs"></div>
    </div>
    <script>
        $( function() {
            if ( !$( "<canvas>" )[0].getContext ) {
            $( "<div>" ).text(
                "Your browser doesn't support canvas, which is required for this demo."
            ).appendTo( "#graphs" );
            return;
        }

        var i = 0,
            width = 100,
            height = 100;

        $.each( $.easing, function( name, impl ) {
            var graph = $( "<div>" ).addClass( "graph" ).appendTo( "#graphs" ),
            text = $( "<div>" ).text( ++i + ". " + name ).appendTo( graph ),
            wrap = $( "<div>" ).appendTo( graph ).css( 'overflow', 'hidden' ),
            canvas = $( "<canvas>" ).appendTo( wrap )[ 0 ];

            canvas.width = width;
            canvas.height = height;
            var drawHeight = height * 0.8,
            cradius = 10;
            ctx = canvas.getContext( "2d" );
            ctx.fillStyle = "black";

            // Draw background
            ctx.beginPath();
            ctx.moveTo( cradius, 0 );
            ctx.quadraticCurveTo( 0, 0, 0, cradius );
            ctx.lineTo( 0, height - cradius );
            ctx.quadraticCurveTo( 0, height, cradius, height );
            ctx.lineTo( width - cradius, height );
            ctx.quadraticCurveTo( width, height, width, height - cradius );
            ctx.lineTo( width, 0 );
            ctx.lineTo( cradius, 0 );
            ctx.fill();

            // Draw bottom line
            ctx.strokeStyle = "#555";
            ctx.beginPath();
            ctx.moveTo( width * 0.1, drawHeight + .5 );
            ctx.lineTo( width * 0.9, drawHeight + .5 );
            ctx.stroke();

            // Draw top line
            ctx.strokeStyle = "#555";
            ctx.beginPath();
            ctx.moveTo( width * 0.1, drawHeight * .3 - .5 );
            ctx.lineTo( width * 0.9, drawHeight * .3 - .5 );
            ctx.stroke();

            // Plot easing
            ctx.strokeStyle = "white";
            ctx.beginPath();
            ctx.lineWidth = 2;
            ctx.moveTo( width * 0.1, drawHeight );
            $.each( new Array( width ), function( position ) {
                var state = position / width,
                 val = impl( state, position, 0, 1, width );
                ctx.lineTo( position * 0.8 + width * 0.1,
                drawHeight - drawHeight * val * 0.7 );
            });
            ctx.stroke();

            // Animate on click
            graph.on( "click", function() {
            wrap
              .animate( { height: "hide" }, 2000, name )
              .delay( 800 )
              .animate( { height: "show" }, 2000, name );
          });

            graph.width( width ).height( height + text.height() + 10 );
            });
        });
    </script>
</body>
</html>
It will help you...
#Jqury UI
