03-Apr-2023
.
Admin
Hi Dev,
In this blog, I would like to share with you how to implement google donut chart in php. We will show create dynamic google donut chart in php and mysql. Make a simple chart by google chart api with php mysql. in this tutorial i going to learn you how to create google donut chart using google api in php with mysql.
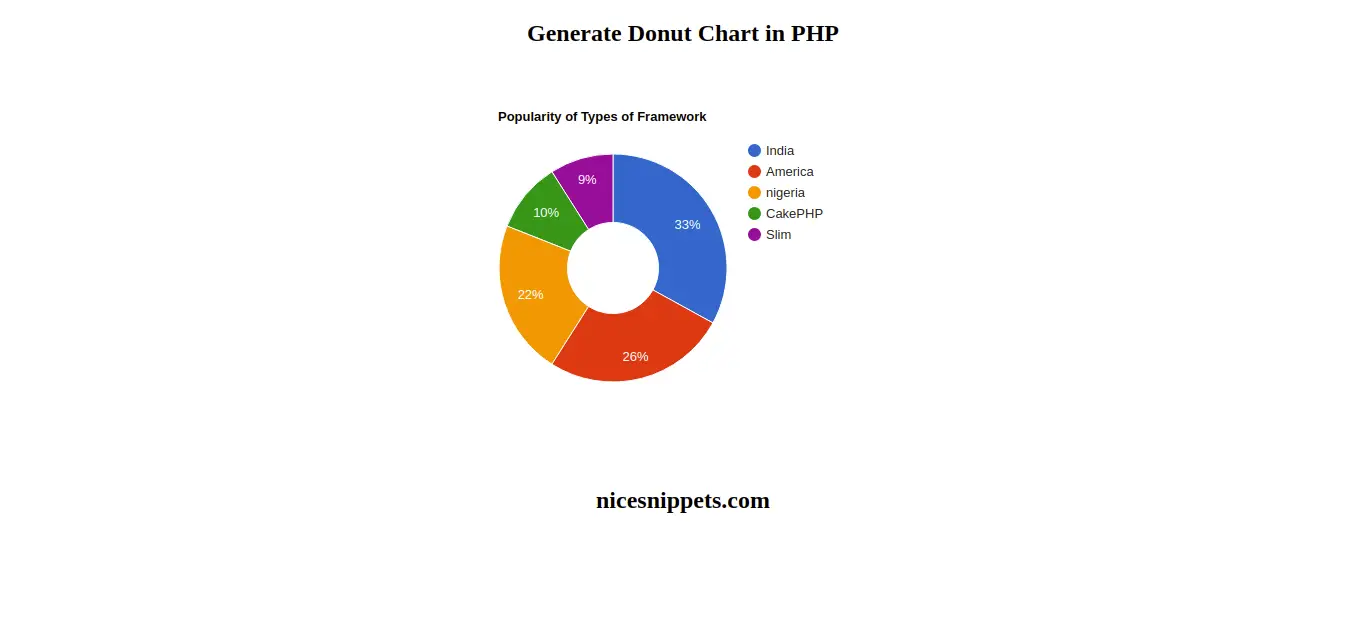
In this example i am create populer framework chart . and I will show total popularity for framework using google donut chart in php with mysql.
Here I will give you full example for create dynamic google donut chart using google api in php, so let's follow bellow step by step.
Step 1 : Create Table
CREATE TABLE `framework` (
  `id` int(11) NOT NULL PRIMARY KEY AUTO_INCREMENT,
  `name` varchar(70) NOT NULL,
  `number` int(11) NOT NULL,
  `timestamp` timestamp NOT NULL DEFAULT CURRENT_TIMESTAMP ON UPDATE CURRENT_TIMESTAMP
) ENGINE=InnoDB DEFAULT CHARSET=latin1
Step 2 : Configuration
Create a config.php file for the database configuration.
config.php
<?php

    $host = "localhost"; /* Host name */
    $user = "root2"; /* User */
    $password = "root"; /* Password */
    $dbname = "post_data"; /* Database name */

    $con = mysqli_connect($host, $user, $password,$dbname);
    // Check connection
    if (!$con) {
     die("Connection failed: " . mysqli_connect_error());
    }

    $chartQuery = "SELECT * FROM column_chart";
    $chartQueryRecords = mysqli_query($con,$chartQuery);
?>
Step 3 : HTML & PHP
In this step,you can use google donut chart api and create google donut chart in this file. Display records from employee table and generate google donut chart with the test table.
index.php
<?php
    include "config.php";
?>
<!DOCTYPE html>
<html>
<head>
    <meta charset="utf-8">
    <script src="https://www.google.com/jsapi"></script>
    <style>
        .pie-chart {
            width: 600px;
            height: 400px;
            margin: 0 auto;
        }
        .text-center{
            text-align: center;
        }
    </style>
</head>
<body>

<h2 class="text-center">Generate Donut Chart in PHP</h2>

<div id="chartDiv" class="pie-chart"></div>

<div class="text-center">
    <h2>nicesnippets.com</h2>
</div>
<?php
  echo "<script>
        var chartRecord =  ".json_encode($chartRecord)."
    </script>";
?>
<script type="text/javascript">
    window.onload = function() {
        google.load("visualization", "1.1", {
            packages: ["corechart"],
            callback: 'drawChart'
        });
    };

    function drawChart() {
        var data = google.visualization.arrayToDataTable([
            ['Country', 'Popularity'],
            <?php
                while($row = mysqli_fetch_assoc($chartQueryRecords)){
                    echo "['".$row['name']."', ".$row['number']."],";
                }
            ?>
        ]);

        var options = {
            pieHole: 0.4,
            title: 'Popularity of Types of Framework',
        };

        var chart = new google.visualization.PieChart(document.getElementById('chartDiv'));
        chart.draw(data, options);
    }

</script>

</body>
</html>
Now we are ready to run our example so run bellow command for quick run:
php -S localhost:8000
Now you can open bellow URL on your browser:
http://localhost:8000/index.php
It will help you..
#PHP
