03-Apr-2023
.
Admin

Hello Friends,
This tutorial shows you php mysql charts js line chart example tutorial. you'll learn how to create chart js line chart in php mysql. We will look at examples of how to implement dynamic graph from php mysql with chart js. let’s discuss how to creating dynamic data graph using php and chart js. You just need to do some steps to do a line chart with chart js in php and mysql.
Creating graph view using Chart.js is simple and easy. I have created the graph output for dynamic data retrieved from the database. I have a MySQL database table tbl_marks containing student marks.
So let's see bellow example:
Stap 1: MYSQLI Connection String
config.php
<?php
    $host_name = "localhost";
    $database = "my_db";        // Change your database name
    $username = "root";         // Your database user id
    $password = "";             // Your password

    $connection = mysqli_connect($host_name, $username, $password, $database);

    if (!$connection) {
        echo "Error: Unable to connect to MySQL.<br>";
        echo "<br>Debugging errno: " . mysqli_connect_errno();
        echo "<br>Debugging error: " . mysqli_connect_error();
        exit;
    }
?>
Stap 2: MySQL table
For this tutorial we will consider a very simple score table.
chart_data_line Table:
CREATE TABLE IF NOT EXISTS `chart_data_line` (
    `month` varchar(10) NOT NULL,
    `sale` int(3) NOT NULL,
    `profit` int(3) NOT NULL,
    `exp_fixed` int(3) NOT NULL,
    `exp_variable` int(3) NOT NULL
) ENGINE=InnoDB DEFAULT CHARSET=utf8;
chart_data_line Table Data:
INSERT INTO `chart_data_line` (`month`, `sale`, `profit`, `exp_fixed`, `exp_variable`) VALUES
    ('Jan', 300, 150, 50, 100),
    ('Feb', 200, 130, 50, 20),
    ('Mar', 300, 200, 50, 50),
    ('April', 400, 300, 50, 50),
    ('May', 300, 200, 50, 50),
    ('Jun', 200, 100, 50, 50),
    ('July', 200, 150, 50, 0),
    ('Jan', 300, 150, 50, 100),
    ('Feb', 200, 130, 50, 20),
    ('Mar', 300, 200, 50, 50),
    ('April', 400, 300, 50, 50),
    ('May', 300, 200, 50, 50),
    ('Jun', 200, 100, 50, 50),
    ('July', 200, 70, 50, 80);
Stap 3: index.php
<!doctype html>
<html>
<head>
<title>PHP MySQL Charts JS Line Chart Example Tutorial : NiceSnippets.com</title>
<style type="text/css">
h2{
margin: 50px 0px 0px 120px;
}
</style>
</head>
<body >
<?Php
require "config.php";// Database connection
if($stmt = $connection->query("SELECT month,sale,profit, exp_fixed,exp_variable FROM chart_data_line")){
echo "<h2>PHP MySQL Charts JS Line Chart Example Tutorial </h2><br>";
}
$php_data_array = Array(); // create PHP array
while ($row = $stmt->fetch_row()) {
$php_data_array[] = $row; // Adding to array
}
?>
<div id="curve_chart"></div>
<br><br>
<script type="text/javascript" src="https://www.gstatic.com/charts/loader.js"></script>
<script type="text/javascript">
// Load the Visualization API and the corechart package.
google.charts.load('current', {packages: ['corechart']});
google.charts.setOnLoadCallback(drawChart);
function drawChart() {
// Create the data table.
var data = new google.visualization.DataTable();
data.addColumn('string', 'Month');
data.addColumn('number', 'Sale');
data.addColumn('number', 'Profit');
data.addColumn('number', 'Exp_fixed');
data.addColumn('number', 'Exp_var');
for(i = 0; i < my_2d.length; i++){
data.addRow([my_2d[i][0], parseInt(my_2d[i][1]),parseInt(my_2d[i][2]),parseInt(my_2d[i][3]),parseInt(my_2d[i][4])]);
var options = {
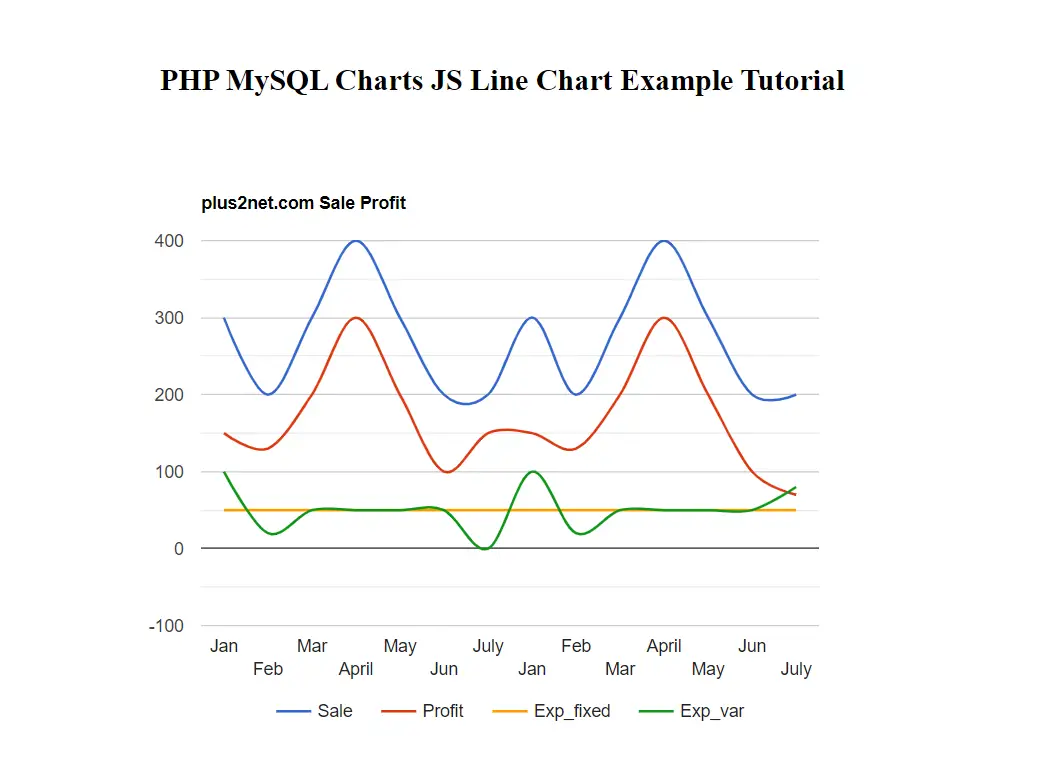
title: 'plus2net.com Sale Profit',
curveType: 'function',
width: 800,
height: 500,
legend: { position: 'bottom' }
};
}
var chart = new google.visualization.LineChart(document.getElementById('curve_chart'));
chart.draw(data, options);
}
</script>
</body>
</html>
Output:
I hope it can help you...
#MySQL
#PHP
