15-Apr-2024
.
Admin

Hi, Dev
In this tutorial, I'll guide you through the process of crafting a line chart using Chart.js within a Laravel 11 application. Chart.js offers a versatile range of chart types including Line Charts, Bar Charts, Pie Charts, Area Charts, and more, enabling us to visualize data effectively. Let's delve into creating a line chart specifically using Chart.js in Laravel 11.
Chart.js is a JavaScript library. This library can be used to create bar charts, line charts, area charts, column charts, etc. Chart.js is an open-source chart library. It also provides several themes and graphs, allowing you to utilize more charts from here: Chart.js Site.
In this demonstration, we'll generate fictitious user data and subsequently showcase a line chart spanning all months of the current year. Follow along with the steps outlined below to seamlessly integrate a chart into your Laravel 11 application.
Step for How to Create Graph using ChartJS in Laravel 11?
Step 1:Install Laravel 11
Step 2:Create Route
Step 3:Create Controller
Step 4:Create Blade File
Step 5:Create Dummy Records
Run Laravel App
Step 1: Install Laravel 11
This step is not required; however, if you have not created the Laravel app, then you may go ahead and execute the below command:
composer create-project laravel/laravel example-app
Step 2: Create Route
First of all, we will create a simple route for creating a simple line chart. So, let's add simple routes as below:
routes/web.php
<?php

use Illuminate\Support\Facades\Route;

use App\Http\Controllers\ChartJSController;

Route::get('chart', [ChartJSController::class, 'index']);
Step 3: Create Controller
Here, we will create a new controller called ChartJSController. So let's add the code below to that controller file.
app/Http/Controllers/ChartJSController.php
<?php

namespace App\Http\Controllers;

use Illuminate\Http\Request;
use Illuminate\View\View;
use App\Models\User;
use DB;

class ChartJSController extends Controller
{
    /**
     * Write code on Method
     *
     * @return View
     */
    public function index(): View
    {
        $users = User::select(DB::raw("COUNT(*) as count"), DB::raw("MONTHNAME(created_at) as month_name"))
                    ->whereYear('created_at', date('Y'))
                    ->groupBy(DB::raw("Month(created_at)"))
                    ->pluck('count', 'month_name');

        $labels = $users->keys();
        $data = $users->values();

        return view('chart', compact('labels', 'data'));
    }
}
Step 4: Create Blade File
Here, we need to create a Blade file, and in this Blade file, we use Highcharts.js and incorporate their code.
resources/views/chart.blade.php
<!DOCTYPE html>
<html>
<head>
    <title>Creating Dynamic Charts with ChartJS in Laravel 11 - NiceSnippets.com</title>
    <link href="https://cdn.jsdelivr.net/npm/bootstrap@5.0.2/dist/css/bootstrap.min.css" rel="stylesheet" crossorigin="anonymous">
</head>

<body>
    <div class="container">
        <div class="card mt-5">
            <h3 class="card-header p-3">Creating Dynamic Charts with ChartJS in Laravel 11 - NiceSnippets.com</h3>
            <div class="card-body">
                <canvas id="myChart" height="120px"></canvas>
            </div>
        </div>
    </div>
</body>

<script src="https://cdnjs.cloudflare.com/ajax/libs/jquery/3.6.0/jquery.min.js" ></script>
<script src="https://cdn.jsdelivr.net/npm/chart.js"></script>

<script type="text/javascript">

      var labels =  {{ Js::from($labels) }};
      var users =  {{ Js::from($data) }};

      const data = {
        labels: labels,
        datasets: [{
          label: 'My First dataset',
          backgroundColor: 'rgb(255, 99, 132)',
          borderColor: 'rgb(255, 99, 132)',
          data: users,
        }]
      };

      const config = {
        type: 'line',
        data: data,
        options: {}
      };

      const myChart = new Chart(
        document.getElementById('myChart'),
        config
      );

</script>
</html>
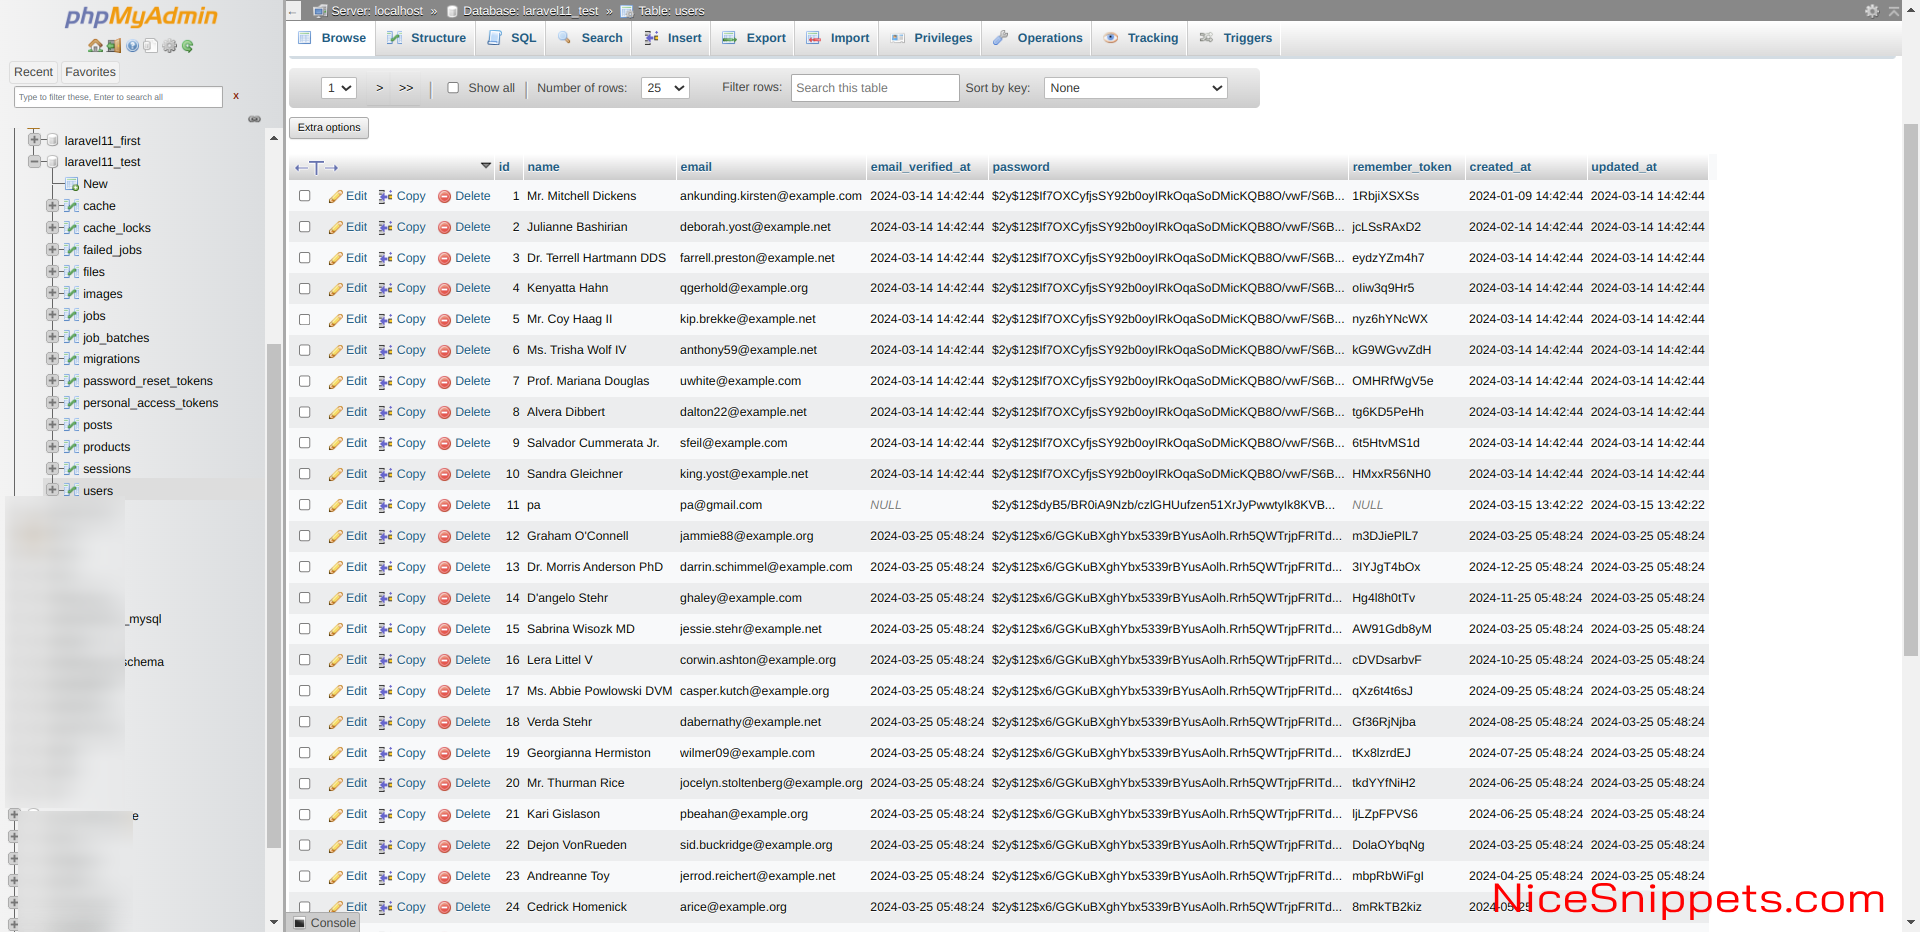
Step 5: Create Dummy Records
Here, we need to add some dummy records on users table as monthly wise.
you can create dummy records using laravel tinker command as bellow:
php artisan tinker

User::factory()->count(30)->create()
You need to create users on each month with created date as like bellow screen shot:
Run Laravel App:
All the required steps have been done, now you have to type the given below command and hit enter to run the Laravel app:
php artisan serve
Now, Go to your web browser, type the given URL and view the app output:
Output:
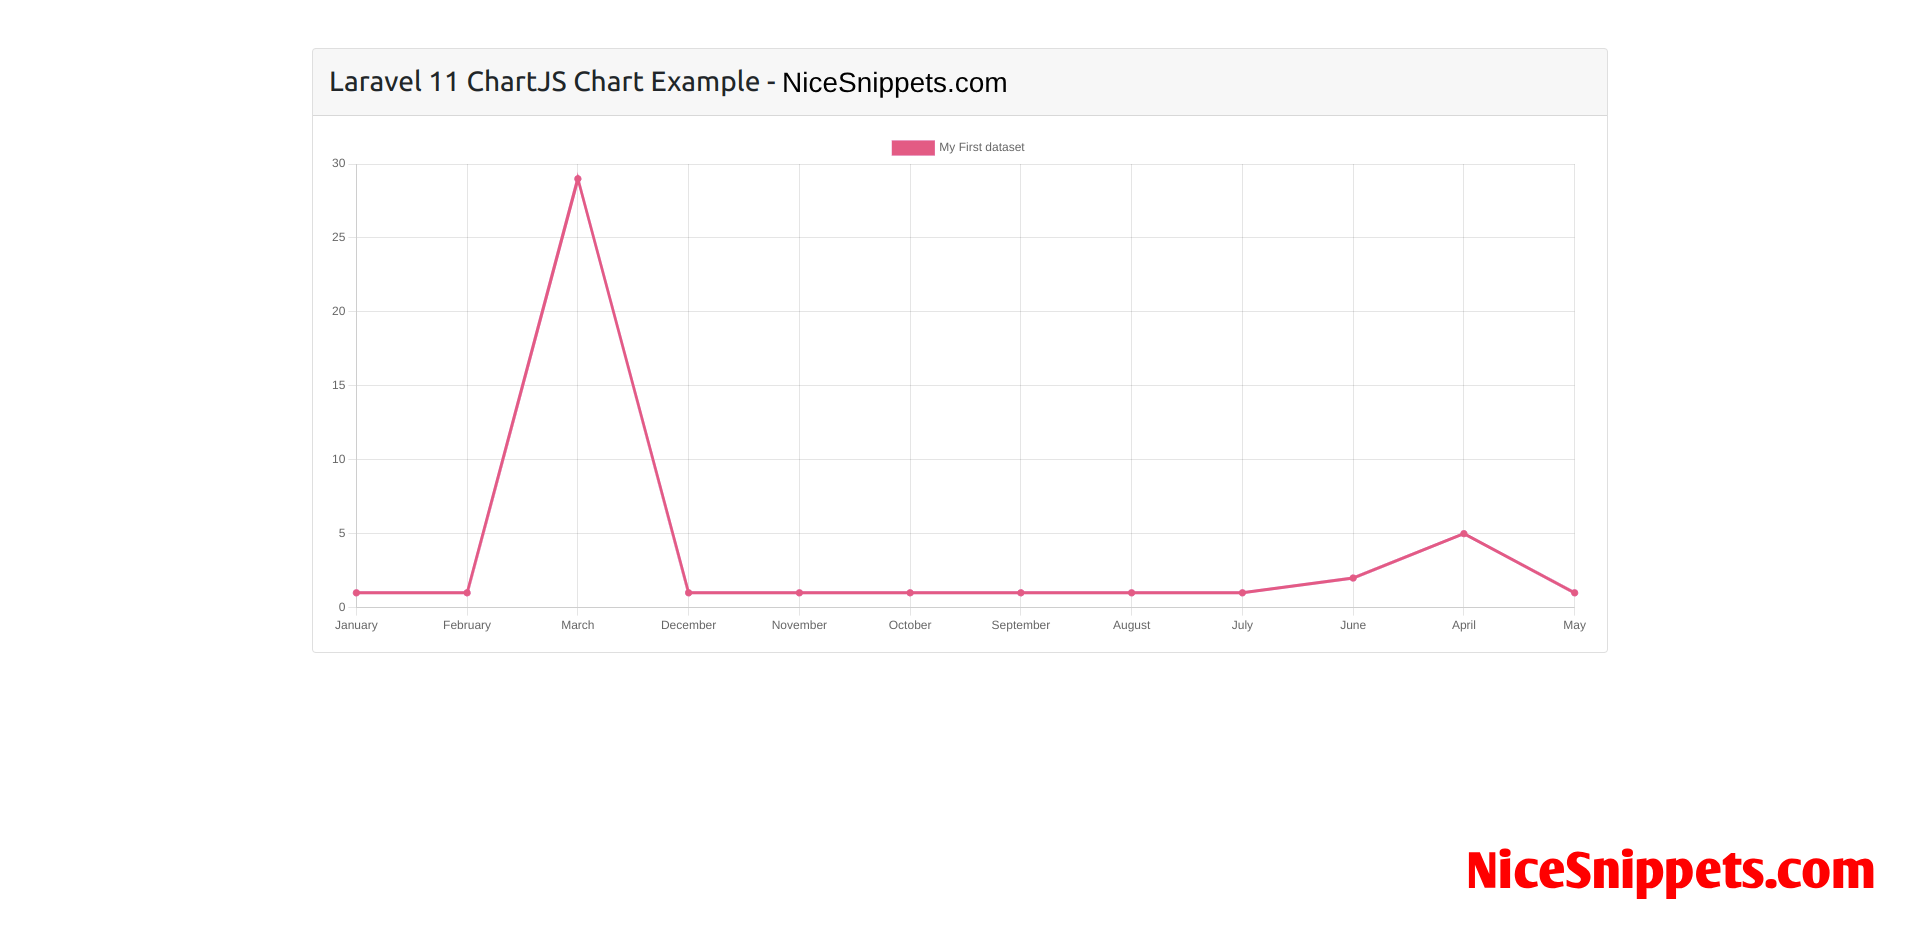
I hope it can help you...
#Laravel 11
