 NiceSnippets.com
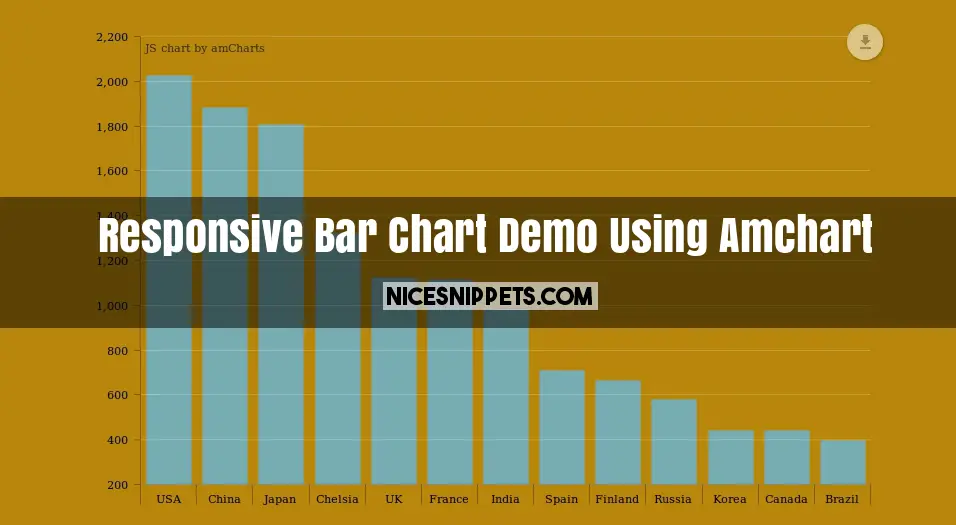
Responsive Bar Chart Demo Using Amchart
Best Bar chart demo using amchart plugin. we are giving you customized responsive bar chart design using html,css and amchart. this bar chart load smoothly and not take time in loading. in this chart you can export in mltiple format like in image formte jpg,png,jpeg,svg,pdf and you can save as csv,json and also print direct.
We allows to free snippets of amcharts multiple column chart , you can download full code of amcharts bar example layout. Here in this post i will give you example of stacked bar chart snippet and you will get simple code of html, css and jquery. In amcharts stacked column chart snippet i give you three tab with html, css and js, you can easily get code of amchart bar chart color change layout.
<!doctype html>
<html lang="en">
<head>
<script src="https://cdnjs.cloudflare.com/ajax/libs/jquery/3.1.1/jquery.min.js"></script>
<script src="https://www.amcharts.com/lib/3/amcharts.js"></script>
<script src="https://www.amcharts.com/lib/3/serial.js"></script>
<script src="https://www.amcharts.com/lib/3/plugins/export/export.min.js"></script>
<link rel="stylesheet" href="https://www.amcharts.com/lib/3/plugins/export/export.css" type="text/css" media="all" />
<script src="https://www.amcharts.com/lib/3/themes/light.js"></script>
</head>
<style type="text/css">
#barChartContainer{
height: 500px;
width: 60%;
margin: 0 auto;
margin-top: 100px;
}
</style>
<body>
<div id="barChartContainer"></div>
</body>
</html>
var chart = AmCharts.makeChart( "barChartContainer", {
"type": "serial",
"theme": "light",
"dataProvider": [ {
"country": "USA",
"visits": 2025
}, {
"country": "China",
"visits": 1882
}, {
"country": "Japan",
"visits": 1809
}, {
"country": "Chelsia",
"visits": 1322
}, {
"country": "UK",
"visits": 1122
}, {
"country": "France",
"visits": 1114
}, {
"country": "India",
"visits": 984
}, {
"country": "Spain",
"visits": 711
}, {
"country": "Finland",
"visits": 665
}, {
"country": "Russia",
"visits": 580
}, {
"country": "Korea",
"visits": 443
}, {
"country": "Canada",
"visits": 441
}, {
"country": "Brazil",
"visits": 395
} ],
"valueAxes": [ {
"gridColor": "#FFFFFF",
"gridAlpha": 0.2,
"dashLength": 0
} ],
"gridAboveGraphs": true,
"startDuration": 1,
"graphs": [ {
"balloonText": "[[category]]: <b>[[value]]</b>",
"fillAlphas": 0.8,
"lineAlpha": 0.2,
"type": "column",
"valueField": "visits"
} ],
"chartCursor": {
"categoryBalloonEnabled": false,
"cursorAlpha": 0,
"zoomable": false
},
"categoryField": "country",
"categoryAxis": {
"gridPosition": "start",
"gridAlpha": 0,
"tickPosition": "start",
"tickLength": 20
},
"export": {
"enabled": true
}
});