08-Feb-2021
.
Admin
Hi Guys,
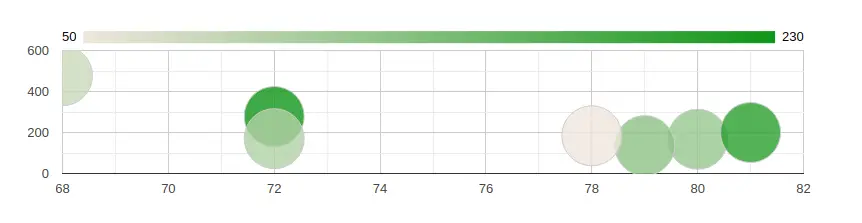
Today,I will learn you how to create Google bubble Charts in Vue js. we will show example of Vue Js Google bubble Charts. I will make vue js google bubble charts example.you can easyliy create google bubble charts in vue js.
Here follow this example of google bubble charts example in vue js.
Creating a Project
here, I this step create new Vue Project.follwing command
vue create chart-project
Installation Package
Now this step,I will install Package vue-google-charts.
npm i vue-google-charts
App.vue
Here this step, Create a new component called ChartApp.vue and paste the following into it:
chart-project/src/components/App.vue
<template>
  <div id="app" style="width:70%;">
    <h1 style="padding-left:80px;">Vue Js Google bubble Charts Example - nicesnippets.com</h1>
    <GChart
      type="BubbleChart"
      :data="chartData"
      :options="chartOptions"
    />
  </div>
</template>

<script>
import { GChart } from "vue-google-charts";
export default {
  name: "App",
  components: {
    GChart
  },
  data() {
    return {
      // Array will be automatically processed with visualization.arrayToDataTable function
      chartData: [
        ["Year", "Blog"],
        ["2018", 180],
        ["2019", 200],
        ["2020", 300],
        ["2021", 30],
      ],
      chartOptions: {
        chart: {
          title: "Company Performance",
          subtitle: "blog in total: year"
        }
      }
    };
  }
};
</script>
Add main.js
In this last, just add your new component in App.vue and everything should look something like this:
chart-project/src/components/main.js
import Vue from 'vue'
import App from './App.vue'

Vue.config.productionTip = false

new Vue({
  render: h => h(App),
}).$mount('#app')
It will help you....
#Vue.Js
#Vue