03-Apr-2023
.
Admin

Hi guys,
Today i will explained Google Bar & Line Charts Example in php Codeigniter 4. This example is so easy to use in Codeigniter 4.
Before we move further, let’s quickly understand what a line chart is.
A line graph is also known as a line chart, primarily a curve chart shows data intuitively as a series of data points called ‘markers’ joined by straight-line portions.
So let's start to the example.
Step 1: Install New Codeigniter App
Codeigniter Project Project install in a two ways.
<?php
https://codeigniter.com/download
or
composer create-project codeigniter4/appstarter project_name
?>
Step 2: Make Database Connection
Open the app/Config/Database.php, and insert database name, username and password into the file.
public $default = [
        'DSN'      => '',
        'hostname' => 'localhost',
        'username' => 'root',
        'password' => '',
        'database' => 'codeigniter_db',
        'DBDriver' => 'MySQLi',
        'DBPrefix' => '',
        'pConnect' => false,
        'DBDebug'  => (ENVIRONMENT !== 'development'),
        'cacheOn'  => false,
        'cacheDir' => '',
        'charset'  => 'utf8',
        'DBCollat' => 'utf8_general_ci',
        'swapPre'  => '',
        'encrypt'  => false,
        'compress' => false,
        'strictOn' => false,
        'failover' => [],
        'port'     => 3306,
    ];
Step 3: Create Table & Insert Data SQL
Then next step to create table and insert to the few records.
CREATE TABLE `product` (
  `id` int(11) NOT NULL COMMENT 'Primary Key',
  `name` varchar(255) NOT NULL COMMENT 'name',
  `sell` varchar(55) NOT NULL COMMENT 'sell',
  `created_at` varchar(30) NOT NULL COMMENT 'created at'
) ENGINE=InnoDB DEFAULT CHARSET=latin1 COMMENT='Atomic database';

INSERT INTO `product` (`id`, `name`, `sell`, `created_at`) VALUES
(1, 'Coca Cola', '5000', '2021-05-01'),
(2, 'Pepsi', '7000', '2021-05-02'),
(3, 'Coke Zero', '19000', '2021-05-03'),
(4, 'Pepsi Max', '1500', '2021-05-04'),
(5, 'Diet Coke', '19000', '2021-05-05'),
(6, 'Pepsi Light', '3000', '2021-05-06'),
(7, 'Gatorade', '22000', '2021-05-07');
Step 4: Create Chart Controller
You have to generate a new controller template, right after that add the following code into the app/Controllers/GColumnChartController.php file.
<?php
namespace App\Controllers;
use CodeIgniter\Controller;

class GColumnChartController extends Controller
{
    public function index() {
        return view('chart');
    }

    public function initChart()
    {
        $db = \Config\Database::connect();
        $builder = $db->table('product');

        $query = $builder->select("COUNT(id) as count, sell as s, DAYNAME(created_at) as day");
        $query = $builder->where("DAY(created_at) GROUP BY DAYNAME(created_at), s")->get();
        $record = $query->getResult();

        $products = [];

        foreach($record as $row) {
            $products[] = array(
                'day'   => $row->day,
                'sell' => floatval($row->s)
            );
        }

        $data['products'] = ($products);
        return view('chart', $data);
    }

}
Step 5: Formulate New Route
next to make the route for showing charts, you need to go to app/Config/Routes.php and define the given below routes in the file
$routes->setDefaultController('GColumnChartController');
$routes->get('/show-google-charts', 'GColumnChartController::initChart');
Step 6: Add Line Chart in View
Then Next, you need to create the view file, where you will constitute the chart using the google chart js, bootstrap and most importantly the data coming from the database.
Add code into app/Views/chart.php file.
<!DOCTYPE html>
<html lang="en">
<head>
    <meta charset="UTF-8">
    <meta name="viewport" content="width=device-width, initial-scale=1.0">
    <title>Google Bar & Column Charts in Codeigniter Nicesnippets.com</title>
    <link rel="stylesheet" href="https://cdn.jsdelivr.net/npm/bootstrap@5.0.2/dist/css/bootstrap.min.css">
</head>
    <body>
        <div class="container">
            <div class="mb-5 mt-5">
                <div id="GoogleLineChart" style="height: 400px; width: 100%"></div>
            </div>

            <div class="mb-5">
                <div id="GoogleBarChart" style="height: 400px; width: 100%"></div>
            </div>
        </div>
        <script type="text/javascript" src="https://www.gstatic.com/charts/loader.js"></script>
        <script>
            google.charts.load('current', {'packages':['corechart', 'bar']});
            google.charts.setOnLoadCallback(drawLineChart);
            google.charts.setOnLoadCallback(drawBarChart);

            // Line Chart
            function drawLineChart() {
                var data = google.visualization.arrayToDataTable([
                    ['Day', 'Products Count'],
                    <?php
                        foreach ($products as $row){
                           echo "['".$row['day']."',".$row['sell']."],";
                    } ?>
                ]);

                var options = {
                    title: 'Line chart product sell wise',
                    curveType: 'function',
                    legend: {
                        position: 'top'
                    }
                };
                var chart = new google.visualization.LineChart(document.getElementById('GoogleLineChart'));
                chart.draw(data, options);
            }

            // Bar Chart
            google.charts.setOnLoadCallback(showBarChart);
            function drawBarChart() {
                var data = google.visualization.arrayToDataTable([
                    ['Day', 'Products Count'],
                    <?php
                        foreach ($products as $row){
                           echo "['".$row['day']."',".$row['sell']."],";
                        }
                    ?>
                ]);
                var options = {
                    title: ' Bar chart products sell wise',
                    is3D: true,
                };
                var chart = new google.visualization.BarChart(document.getElementById('GoogleBarChart'));
                chart.draw(data, options);
            }
        </script>
    </body>
</html>
Step 7: Start CI Project
In this last step, you have to open the terminal, type command to run the application.
php spark serve
Then next run the url in your browser.
http://localhost:8080/show-google-charts
Output
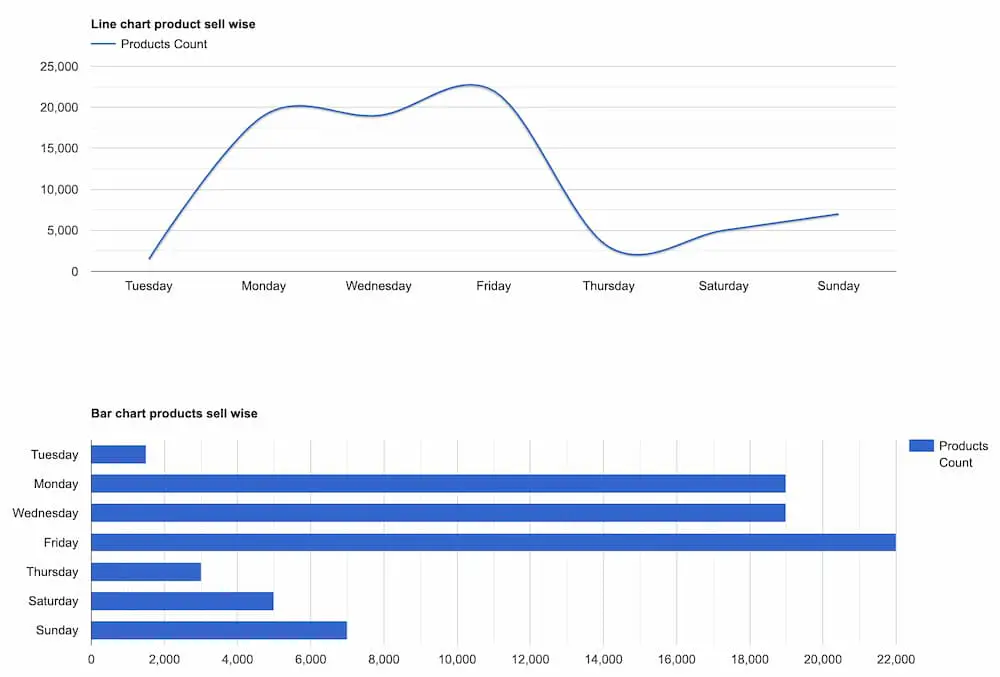
Now you can check your own.
I hope it can help you...
#Codeigniter 4
#PHP 8
#Codeigniter
#PHP