10-Apr-2023
.
Admin
Hi guys,
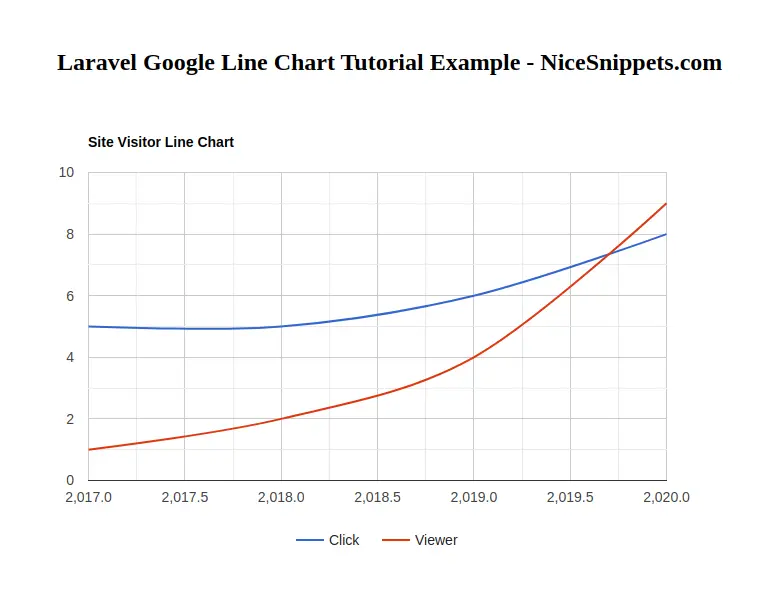
In this blog,I would like to share you how to create google line chart in laravel application.We will implement google line chart in laravel app.I am going to learn you laravel create line chart in laravel.
Google charts JS API is also very popular and it is pretty simple to integrate with our application or projects.Google charts js provide several other charts like bar chart, Area chart, Column Chart, Pie Chart, GEO Chart etc.
Here I will give full example for laravel google line chart tutorial step by step.So Let's follow bellow step by step.
Step 1 : Install Laravel App
In this step, You can install laravel fresh app. So open terminal and put the bellow command.
composer create-project --prefer-dist laravel/laravel blog
Step 2 : Setup Database Configuration
After successfully install laravel app thenafter configure databse setup. We will open ".env" file and change the database name, username and password in the env file.
DB_CONNECTION=mysql
DB_HOST=127.0.0.1
DB_PORT=3306
DB_DATABASE=Enter_Your_Database_Name
DB_USERNAME=Enter_Your_Database_Username
DB_PASSWORD=Enter_Your_Database_Password
Step 3 : Create Table Migration and Model
In this step we have to create migration for posts table and Post Model using Laravel php artisan command, so first fire bellow command:
php artisan make:model Post -m
After this command you have to put bellow code in your migration file for create posts table.
/database/migrations/2020_06_25_100722_create_posts_table.php
<?php

use Illuminate\Database\Migrations\Migration;
use Illuminate\Database\Schema\Blueprint;
use Illuminate\Support\Facades\Schema;

class CreatePostsTable extends Migration
{
    /**
     * Run the migrations.
     *
     * @return void
     */
    public function up()
    {
        Schema::create('posts', function (Blueprint $table) {
            $table->id();
            $table->string('title');
            $table->integer('visitor');
            $table->integer('click');
            $table->timestamps();
        });
    }

    /**
     * Reverse the migrations.
     *
     * @return void
     */
    public function down()
    {
        Schema::dropIfExists('posts');
    }
}
Now we require to run migration be bellow command:
php artisan migrate
Ok, now you can add few records like as bellow :

After you have to put bellow code in your Post model file for create posts table.
app/Post.php
<?php

namespace App;

use Illuminate\Database\Eloquent\Model;

class Post extends Model
{
    protected $fillable = ['title','visitor','click'];
}
Step 3 : Create Route
now, we need to add for PostController in laravel application. so open your "routes/web.php" file and add following route.
routes/web.php
Route::get('google-line-chart', 'PostController@googleLineChart');
Step 4 : Create Controler
Here this step now we should create new controller as PostController. So run bellow command and create new controller.
php artisan make:controller PostController
successfully run above command then,you can create method for get visitor and click fetch record posts table. So Let's copy bellow and put in the controller file.
app/http/controller/PostController.php
<?php

namespace App\Http\Controllers;

use Illuminate\Http\Request;
use App\Post;
use DB;

class PostController extends Controller
{
    public function googleLineChart()
    {
        $visitor = DB::table('posts')
                    ->select(
                        DB::raw("year(created_at) as year"),
                        DB::raw("SUM(click) as total_click"),
                        DB::raw("SUM(visitor) as total_viewer"))
                    ->groupBy(DB::raw("year(created_at)"))
                    ->get();

        $result[] = ['Year','Click','Viewer'];
        foreach ($visitor as $key => $value) {
            $result[++$key] = [$value->year, (int)$value->total_click, (int)$value->total_viewer];
        }

        return view('googleLineChart')
                ->with('visitor',json_encode($result));
    }
}
Step 5 : Create Blade File
In last step. In this step we have to create blade file. So mainly we have to create google line chart view file for show line chart. So finally you have to create following file and put bellow code:
/resources/views/googleLineChart.blade.php
<html>
<head>
    <title>laravel google line chart tutorial example - NiceSnippets.com</title>
    <script type="text/javascript" src="https://www.gstatic.com/charts/loader.js"></script>
</head>
<body>
    <h2 style="margin:50px 0px 0px 130px;">Laravel Google Line Chart Tutorial Example - NiceSnippets.com</h2>
    <div id="linechart" style="width: 900px; height: 500px;"></div>
    <script type="text/javascript">
        var visitor = <?php echo $visitor; ?>;
        console.log(visitor);
        google.charts.load('current', {'packages':['corechart']});
        google.charts.setOnLoadCallback(drawChart);
        function drawChart() {
            var data = google.visualization.arrayToDataTable(visitor);
            var options = {
                title: 'Site Visitor Line Chart',
                curveType: 'function',
                legend: { position: 'bottom' }
            };
            var chart = new google.visualization.LineChart(document.getElementById('linechart'));
            chart.draw(data, options);
        }
    </script>
</body>
</html>
Now we are ready to run our example so run bellow command for quick run:
php artisan serve
Now you can open bellow URL on your browser:
http://localhost:8000/google-line-chart
It will help you...
#Laravel 7
#Laravel
#Laravel 6