10-Apr-2023
.
Admin

Now let's see example of how to implement highchart in laravel 8 application. In this article i will show you highchart in laravel 8. We will learn how to add highchart in laravel 8. let's discuss about how to use highchart in laravel 8.
Here i will give you simple and easy way to use highchart in laravel 8. In this example i am going to show month in total user count with highchart in laravel 8.
Highcharts is a js library, this library through we can use bar chart, line chart, area chart, column chart etc. Highcharts is a open source chart library. Highcharts also provide sevral theme and graph that way you can use more chart from here : HighCharts Site
Now let's see bellow example for how to use highchart in laravel 8. So let's follow bellow step by step:
Step 1: Install Laravel Project
First, you need to download the laravel fresh setup. Use this command then download laravel project setup :
composer create-project --prefer-dist laravel/laravel blog
Step 2: Setup Database
After successfully install laravel 8 Application, Go to your project .env file and set up database credential and move next step :
DB_CONNECTION=mysql
DB_HOST=127.0.0.1
DB_PORT=3306
DB_DATABASE=here your database name
DB_USERNAME=here database username
DB_PASSWORD=here database password
Step 3 : Add Route
first of all we will create simple route for creating simple line chart. so let's add simple routes as like bellow:
routes/web.php
use App\Http\Controllers\HighChartController;

Route::get('high-chart', [HighChartController::class, 'index']);
Step 4 : Create Controller
Here, we will create new controller as ChartController. so let's add bellow code on that controller file.
app\Http\Controllers\HighChartController
<?php

namespace App\Http\Controllers;

use Illuminate\Http\Request;
use App\Models\User;

class HighChartController extends Controller
{
    public function index()
    {
        $users = User::select(\DB::raw("COUNT(*) as count"))
                    ->whereYear('created_at', date('Y'))
                    ->groupBy(\DB::raw("Month(created_at)"))
                    ->pluck('count');

        return view('highChart', compact('users'));
    }
}
Step 5 : Create View file
here, we need to create blade file and in this blade file we use highchart js and use their code.
resources/views/highChart.blade.php
<!DOCTYPE html>
<html>
<head>
    <title>Laravel 8 Highcharts Example - NiceSnippets.com</title>
    <link rel="stylesheet" href="https://cdnjs.cloudflare.com/ajax/libs/twitter-bootstrap/4.5.2/css/bootstrap.min.css" integrity="sha512-MoRNloxbStBcD8z3M/2BmnT+rg4IsMxPkXaGh2zD6LGNNFE80W3onsAhRcMAMrSoyWL9xD7Ert0men7vR8LUZg==" crossorigin="anonymous" />
</head>
<body>
    <div class="container mt-5">
        <h2 class="text-center"><strong>Laravel 8 Highcharts Example - NiceSnippets.com</strong></h2>
        <div id="hight-chart"></div>
    </div>
</body>
<script src="https://code.highcharts.com/highcharts.js"></script>
<script type="text/javascript">
    var users =  <?php echo json_encode($users) ?>;

    Highcharts.chart('hight-chart', {
        title: {
            text: 'New User Growth, 2019'
        },
        subtitle: {
            text: 'Source: NiceSnippets.com'
        },
         xAxis: {
            categories: ['Jan', 'Feb', 'Mar', 'Apr', 'May', 'Jun', 'Jul', 'Aug', 'Sep', 'Oct', 'Nov', 'Dec']
        },
        yAxis: {
            title: {
                text: 'Number of New Users'
            }
        },
        legend: {
            layout: 'vertical',
            align: 'right',
            verticalAlign: 'middle'
        },
        plotOptions: {
            series: {
                allowPointSelect: true
            }
        },
        series: [{
            name: 'New Users',
            data: users
        }],
        responsive: {
            rules: [{
                condition: {
                    maxWidth: 500
                },
                chartOptions: {
                    legend: {
                        layout: 'horizontal',
                        align: 'center',
                        verticalAlign: 'bottom'
                    }
                }
            }]
        }
});
</script>
</html>
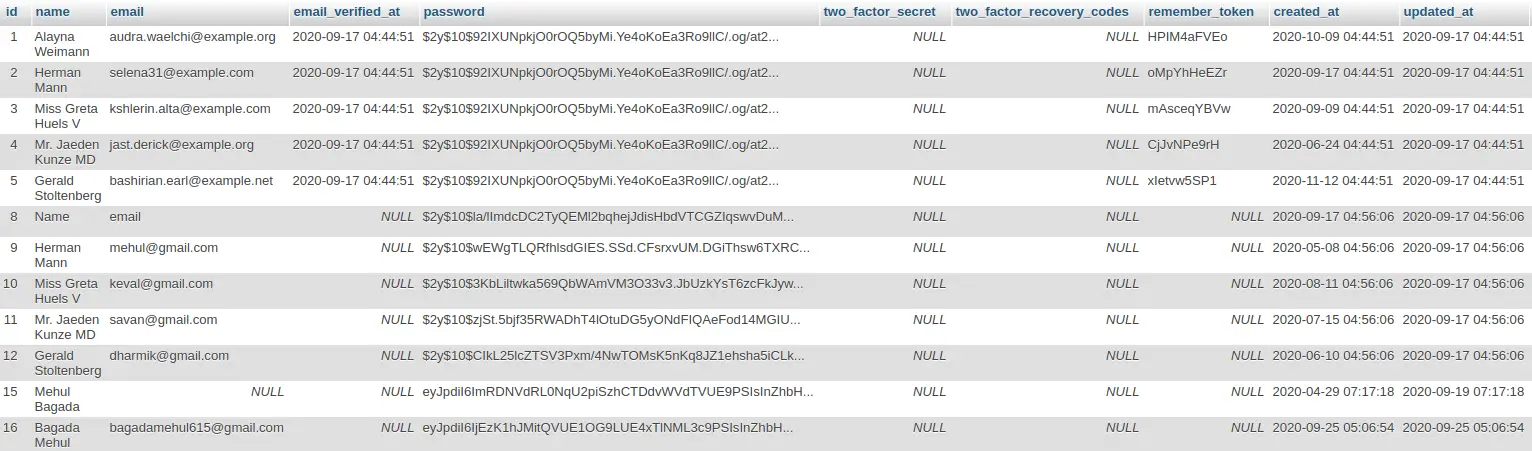
Step 6 : Create Dummy Records:
Here, we need to add some dummy records on users table as monthly wise. You need to create users on each month with created date as like bellow screen shot
Step : 7 Run Your Project
Now we are ready to run our example so run bellow command for quick run:
php artisan serve
Now you can open bellow URL on your browser:
http://localhost:8000/high-chart
It will help you.....
#Laravel 8
#Laravel